Call

Desmos on the Digital SAT

Every SAT math question comes with a built-in Desmos graphing calculator. Here is what to type, what to read, and when to trust the answer, with real screenshots. Free, from the tutors at High Performance Tutoring.

A tutor working one-on-one with a student on SAT prep

Updated October 2026 by the High Performance Tutoring SAT team. Every example below was run in Desmos and checked by hand.

Start here

Learn These Five First

If you practice only five moves before test day, make them these. Tap one to jump to it.

Practice along in the free Desmos testing calculator (choose the SAT version).

Use x and y

Desmos graphs against x. If the question uses another letter, like \(t\) or \(n\), retype it with x so the graph means what you think.

Type it the way Desmos reads it

Wrap fractions in parentheses: (x+1)/(x-3), not x+1/x-3. After ^2 or a fraction, press the right arrow to step back out before you keep typing.

Click the curve, then the point

Clicking a graph shows gray dots at its intercepts, turning points, and intersections. Click a dot to see its coordinates.

Zoom out before you conclude

The home button only resets the default view. Zoom out, or set the axes from the wrench menu to fit the numbers in the problem, so nothing hides off-screen.

Learn these first

The Core Moves

Start with these five. Each card shows what to type, what to read, and the mistake to avoid.

Evaluate a function

When you see

\(f(x)\) is defined and the question asks for \(f(7)\), or for a value like \(f(3) - f(1)\).

Type
f(x)=x^2-5x+6f(7)
Read

Desmos prints the value at the right of the second line: \(f(7) = 20\).

The catch: Define the function once with \(f(x)=\), then you can type \(f(7)\), \(f(-2)\), or \(f(3)-f(1)\) on new lines without retyping anything.
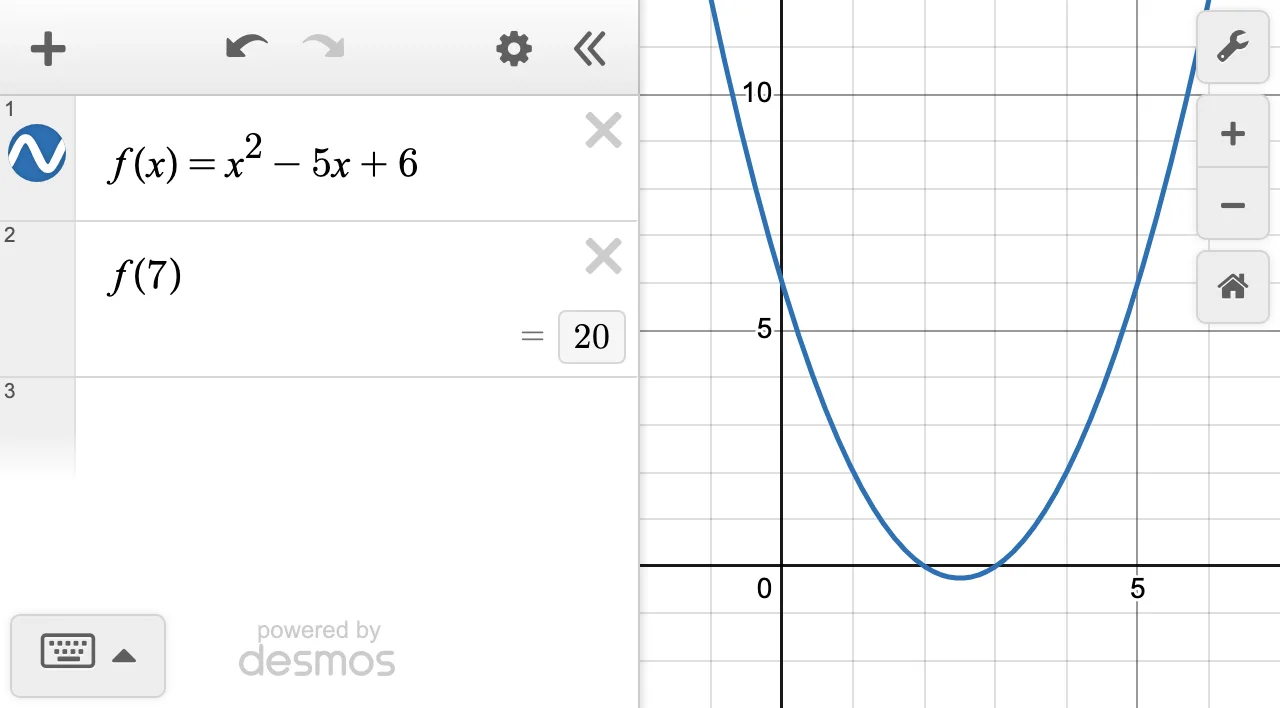
Desmos with f(x) = x squared minus 5x plus 6 on line 1 and f(7) on line 2, which shows the value 20.
Screenshot: Desmos graphing calculator · tap to enlarge

Solve an equation

When you see

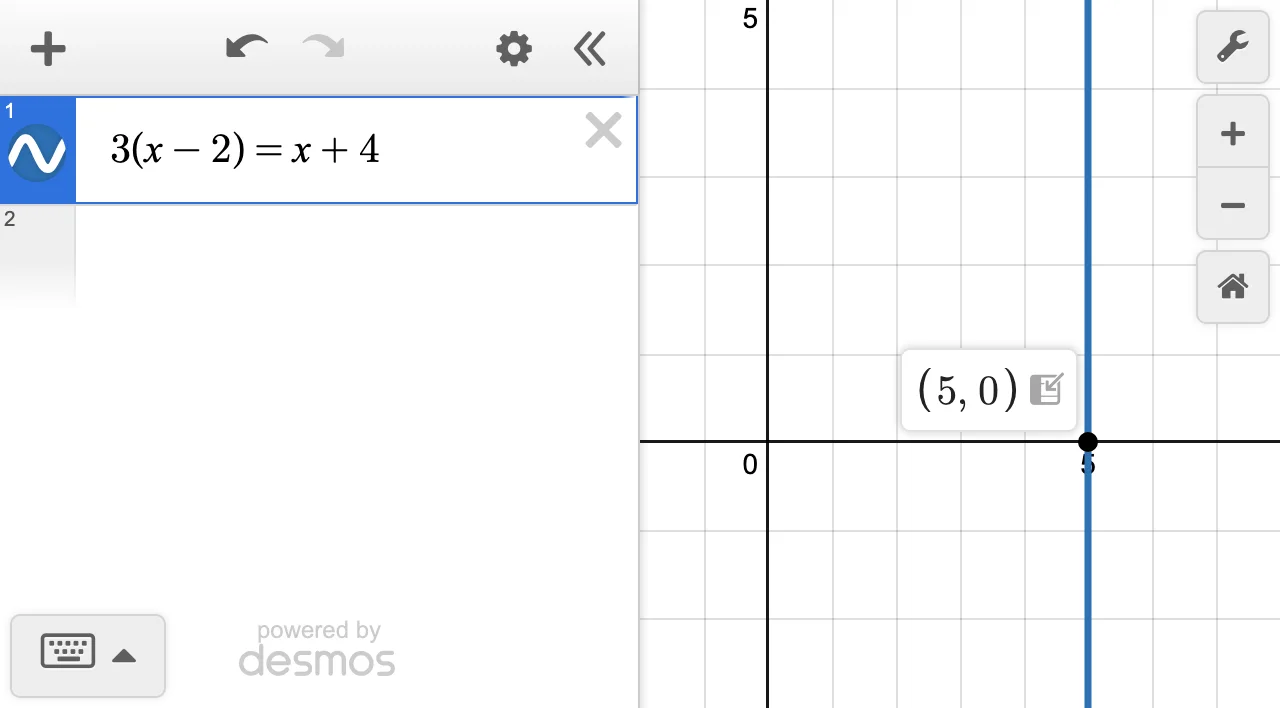
An equation with one unknown, like \(3(x - 2) = x + 4\).

Type
3(x-2)=x+4
Read

Each solution appears as a vertical line. Click where it crosses the x-axis to read it: \((5, 0)\), so \(x = 5\).

The catch: Look for every line, not just the first. \(x^2 = 9\) draws two lines, at \(x = -3\) and \(x = 3\). And no visible line is not proof of no solution: check your typing and the window, then confirm with algebra.
Desmos with 3(x minus 2) = x plus 4 graphed as a vertical line; the point (5, 0) is labeled.
Screenshot: Desmos graphing calculator · tap to enlarge

Find where two graphs meet

When you see

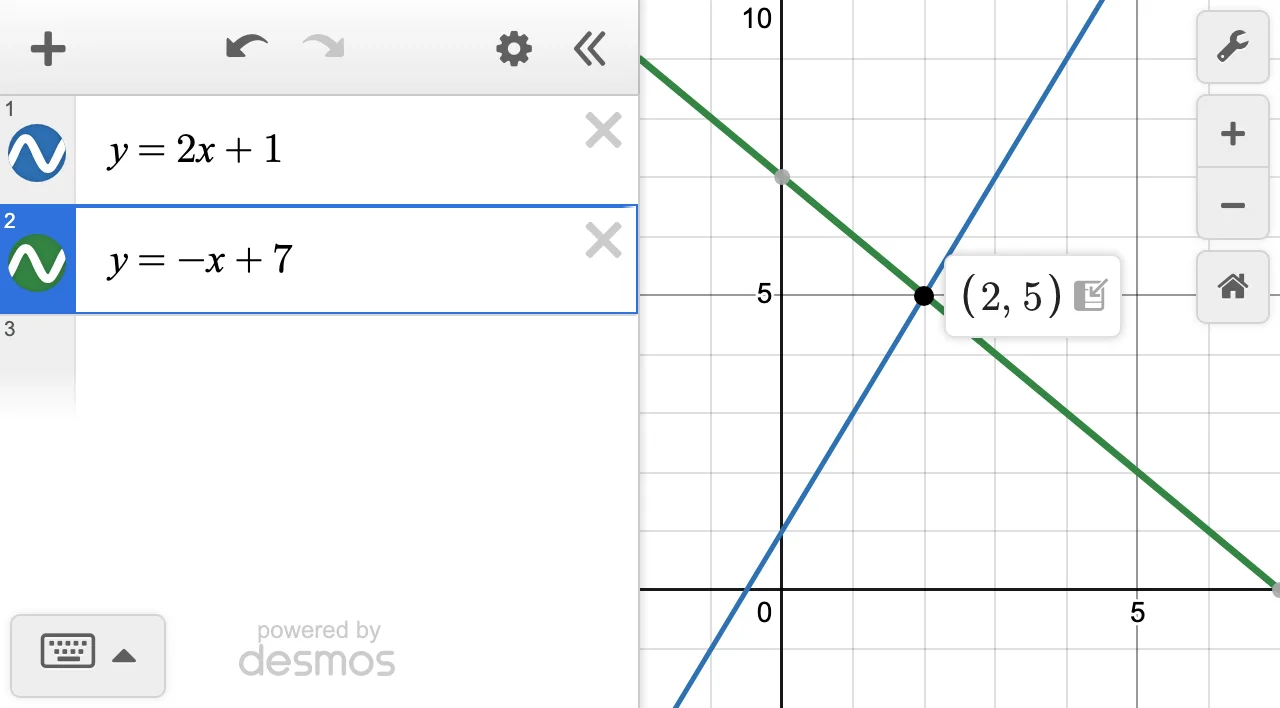
A system of equations, "find the solution \((x, y)\)," or "for what x is \(f(x) = g(x)\)?"

Type
y=2x+1y=-x+7
Read

Click either line, then click the gray dot where they cross: \((2, 5)\).

The catch: Check what the question asks for. It may want \(x\), \(y\), or \(x + y\), not the whole point. Curves can meet more than once: \(y = x^2\) and \(y = x + 2\) meet at \((-1, 1)\) and \((2, 4)\).
Desmos with y = 2x plus 1 and y = negative x plus 7; their intersection (2, 5) is labeled.
Screenshot: Desmos graphing calculator · tap to enlarge

Find zeros (roots, x-intercepts)

When you see

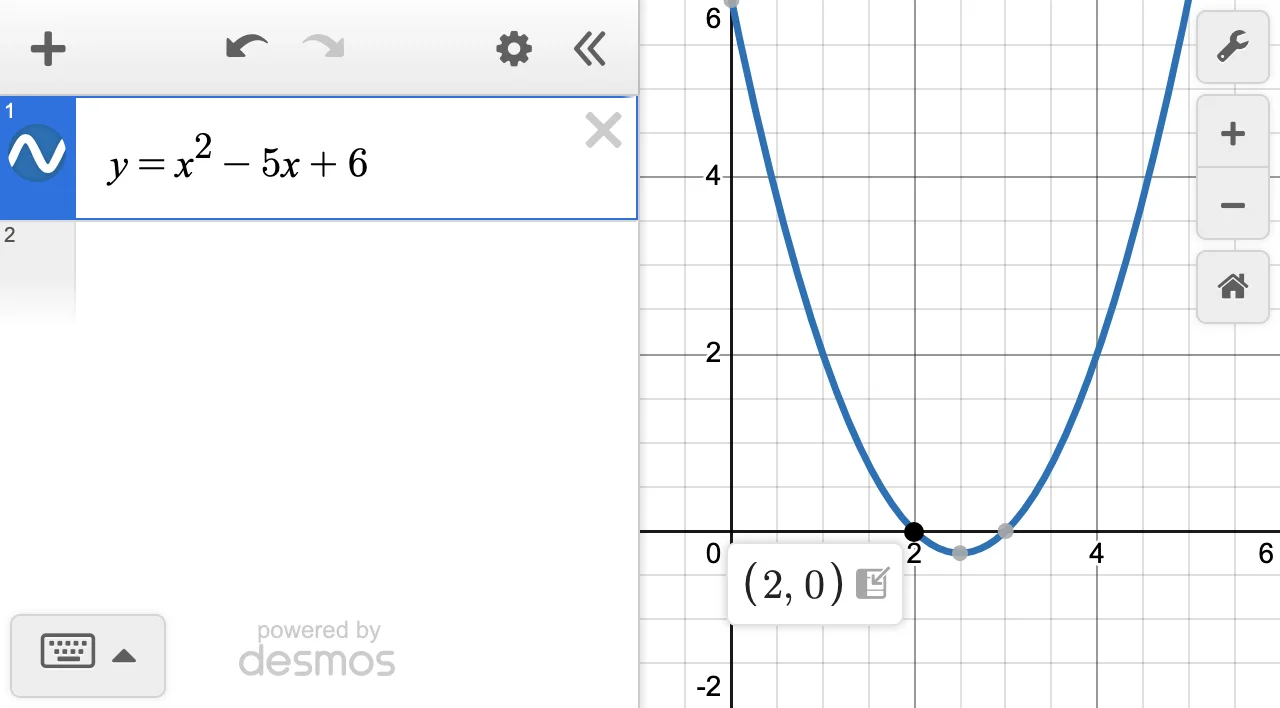
"For what values of x does \(f(x) = 0\)?" or "What are the x-intercepts?"

Type
y=x^2-5x+6
Read

Click the curve; gray dots appear where it meets the x-axis. Click each one: \((2, 0)\) and \((3, 0)\), so the zeros are \(2\) and \(3\).

The catch: A graph can touch the axis without crossing it. \(y = (x - 2)^2\) only touches at \((2, 0)\), and that still counts as a zero. Report the x-value, not the point, when the question asks for a root.
Desmos with y = x squared minus 5x plus 6; the zero (2, 0) is labeled and a second gray dot marks (3, 0).
Screenshot: Desmos graphing calculator · tap to enlarge

Find a vertex, maximum, or minimum

When you see

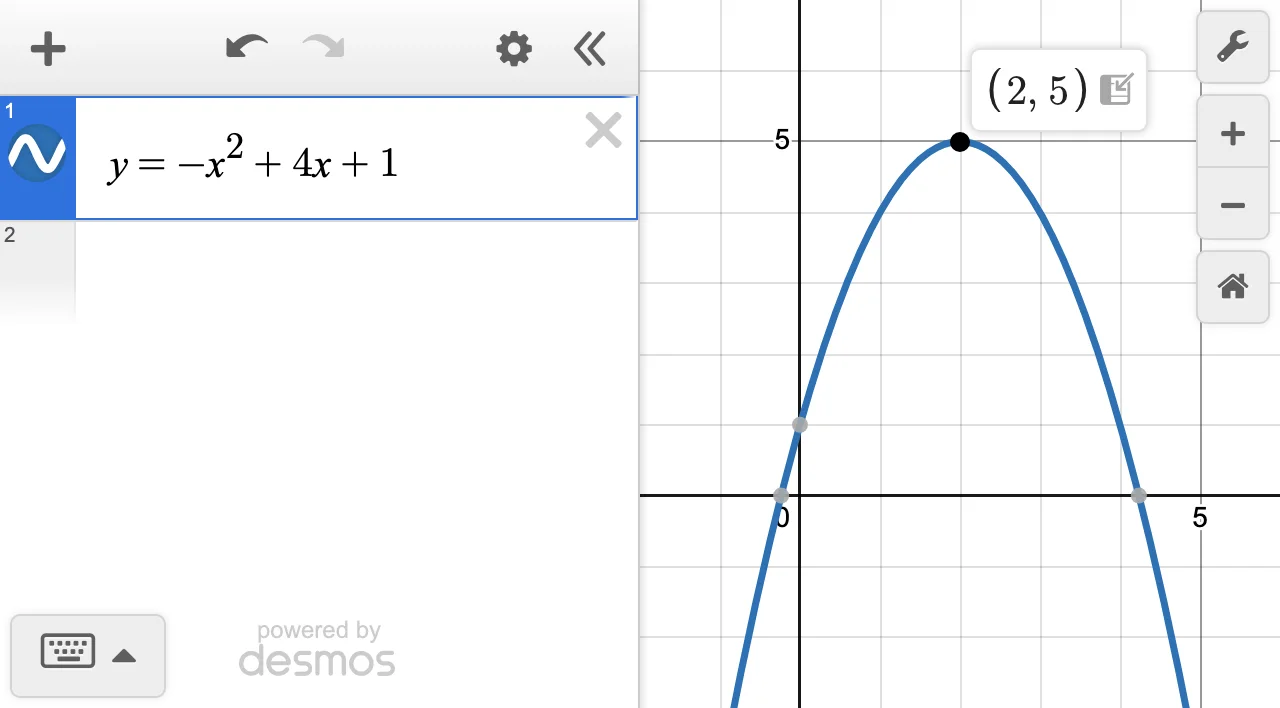
The highest or lowest point of a parabola, or a maximum or minimum value.

Type
y=-x^2+4x+1
Read

Click the curve, then the gray dot at the turning point: \((2, 5)\).

The catch: Read the question twice. "What is the maximum value?" wants \(5\), the y-coordinate. "At what x does it occur?" wants \(2\). In a word problem, also check that the x-value makes sense in context (no negative time).
Desmos with y = negative x squared plus 4x plus 1; the vertex (2, 5) is labeled.
Screenshot: Desmos graphing calculator · tap to enlarge
Back to topics ↑
When the question gives you numbers

Tables & Data

Two moves for questions built on a list of values.

Test several values with a table

When you see

"Which of these values satisfies...?" or evaluating one function at a list of inputs.

Type
f(x)=x^2-5x+6

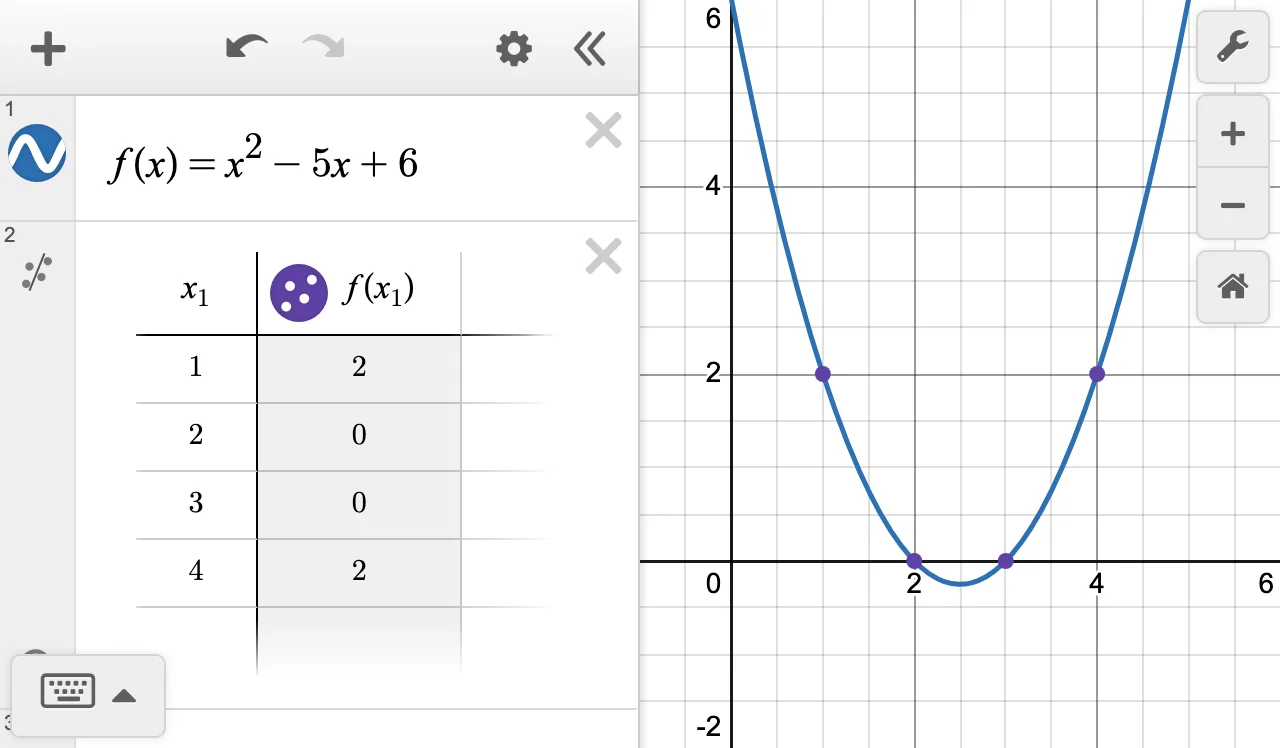
Then add a table from the + menu, type 1, 2, 3, 4 under x₁, and change the second column's header to f(x1).

Read

The second column fills in on its own: \(2, 0, 0, 2\). So \(x = 2\) and \(x = 3\) make the expression equal 0.

The catch: The column header has to use the table's own input, \(f(x_1)\), not \(f(x)\). Typing x1 makes the subscript automatically.
Desmos with f(x) defined on line 1 and a table with x1 values 1, 2, 3, 4 and a computed column f(x1) showing 2, 0, 0, 2.
Screenshot: Desmos graphing calculator · tap to enlarge

Fit a line to data

When you see

The question gives you a table of numbers and asks for a line of best fit, a slope, or a prediction.

Type

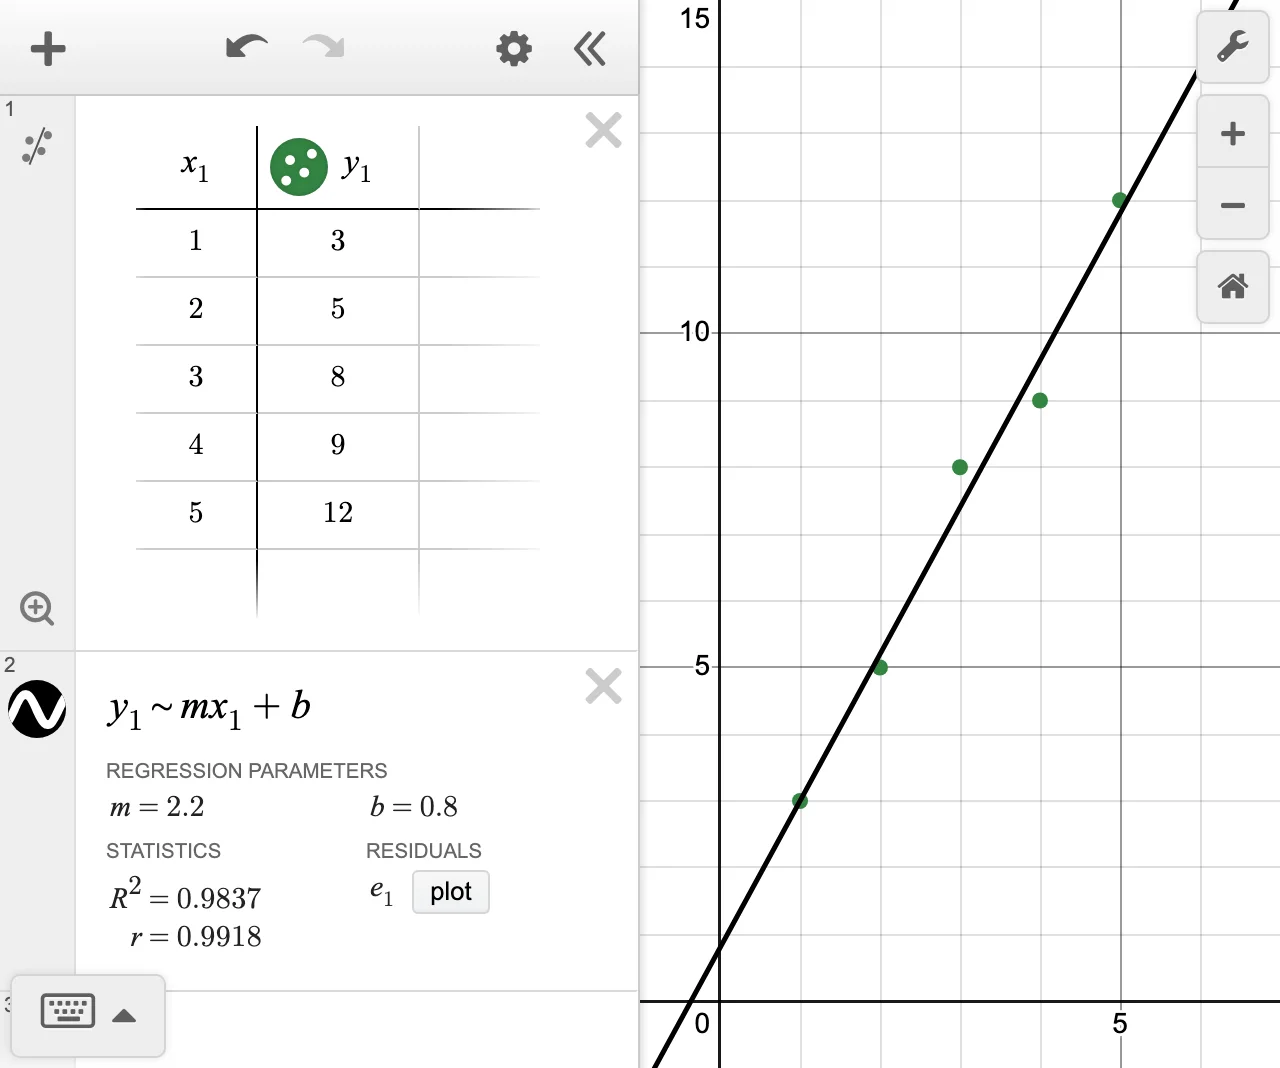
First add a table from the + menu with x₁ = 1, 2, 3, 4, 5 and y₁ = 3, 5, 8, 9, 12. Then, on a new line:

y1~mx1+b
Read

Desmos reports the best-fit values under the line: \(m = 2.2\), \(b = 0.8\), so the line is \(y = 2.2x + 0.8\).

The catch: Use the tilde (~), not =. For a curved pattern, y1~ax1^2+bx1+c fits a quadratic. If the question shows a scatterplot without exact numbers, or already draws the line, you don't need a regression: read the graph.
Desmos with a five-row table and the regression y1 ~ m x1 + b, reporting m = 2.2 and b = 0.8, with the fitted line through the points.
Screenshot: Desmos graphing calculator · tap to enlarge
Back to topics ↑
Useful, with care

Two More Moves

Handy, but each needs a final check from you.

Check a system of inequalities

When you see

"Which point is a solution to the system?" or "Which region shows the solutions?"

Type
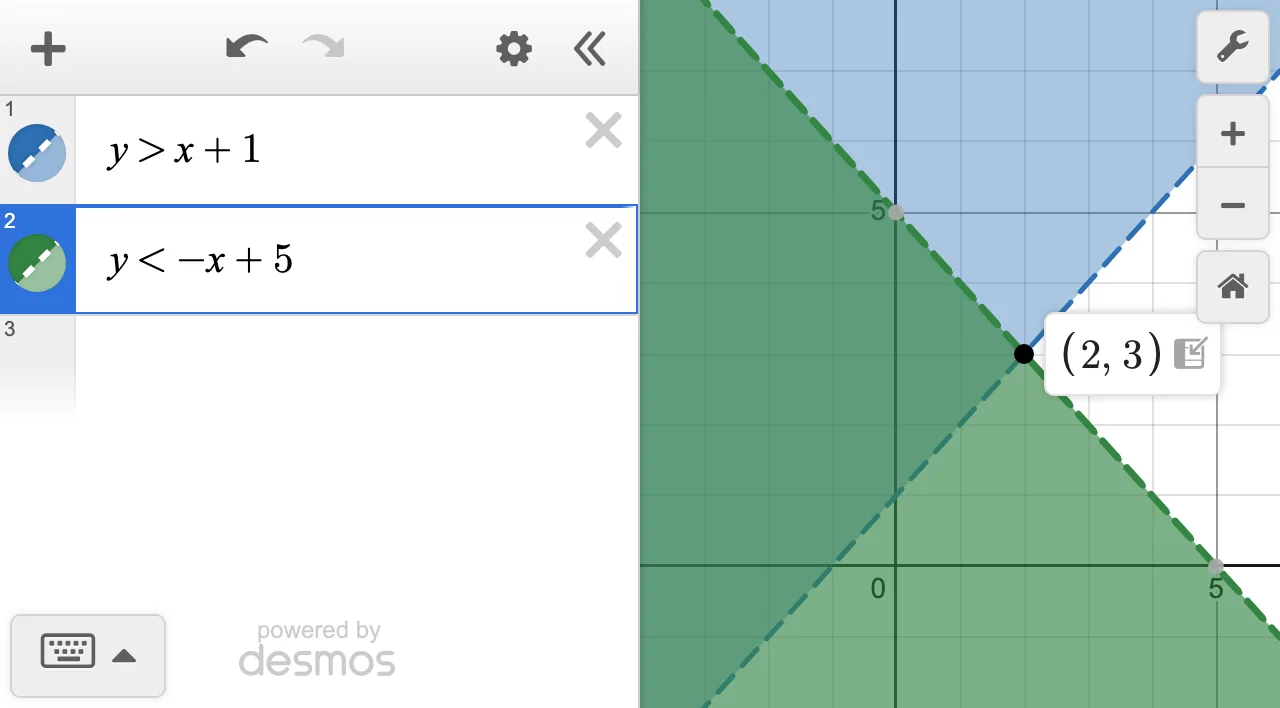
y>x+1y<-x+5
Read

Each inequality shades its side. The solutions are the region shaded by both, the wedge to the left of \((2, 3)\).

The catch: Dashed boundary lines (from \(>\) or \(<\)) are not included. To test an answer choice, type the point, like (0,3), and see whether it lands inside the double-shaded region.
Desmos with y greater than x plus 1 and y less than negative x plus 5 shaded; the overlap lies left of the labeled corner (2, 3).
Screenshot: Desmos graphing calculator · tap to enlarge

Explore a constant, then verify

When you see

"For what value of \(k\) does \(x^2 - 4x + k = 0\) have exactly one real solution?"

Type
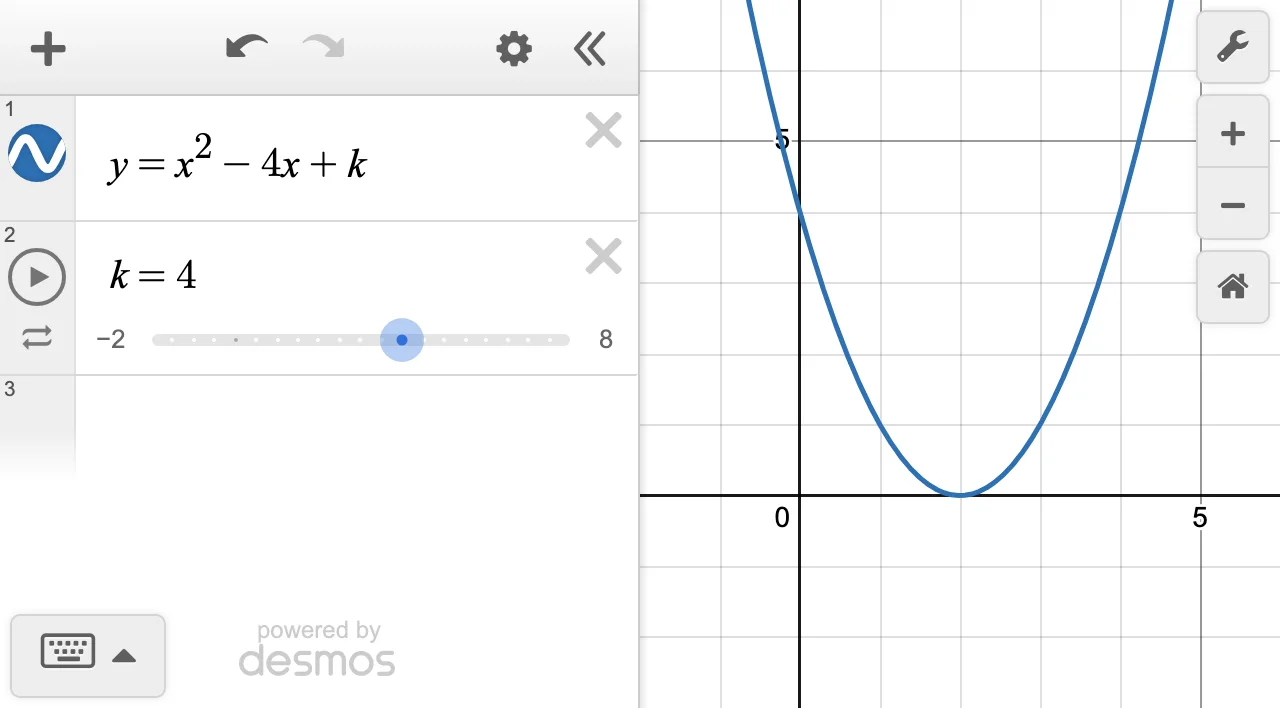
y=x^2-4x+k

When Desmos offers "add slider" for k, click it.

Read

Graphing \(y = x^2 - 4x + k\) turns the equation's real solutions into x-intercepts. One solution means one intercept, so drag \(k\) until the parabola just touches the x-axis. It looks like \(k = 4\).

The catch: A slider only suggests the answer, because "almost touching" looks the same as touching. Confirm with algebra: one solution means the vertex sits on the axis. The vertex is at \(x = 2\), where \(y = k - 4\), so \(k = 4\).
Desmos with y = x squared minus 4x plus k and a slider set to k = 4; the parabola touches the x-axis at x = 2.
Screenshot: Desmos graphing calculator · tap to enlarge
Back to topics ↑
Know when to skip it

When Not to Use Desmos

Desmos is a tool, not a rule. Solve by hand when it is faster or more exact.

One-step arithmetic or a quick percent. Typing takes longer than thinking.
Questions about expressions with letters only, like "which expression is equivalent to...?" A graph can't show you the rewritten form (though graphing two choices to see if they match can rule some out).
Exact conditions on a constant in a linear equation or system, like "no solution" or "infinitely many solutions." Compare the coefficients (slopes and intercepts) instead of judging lines that look parallel or overlapping.
Any question where setting it up in Desmos takes longer than solving it.
The HPT difference

The Calculator Is Easy. The Traps Are the Test.

Desmos gives you a correct graph. These five habits keep you from reading the wrong thing off it.

1. The off-screen answer

An intersection or zero can sit outside the window. Zoom out before deciding there is none, and confirm no-solution or same-line cases from the equations.

2. The rounded readout

Coordinates Desmos shows can be rounded decimals. If the choices are fractions or radicals, type each choice into Desmos and compare its decimal to the readout. If two choices round to the same value, check by substitution or algebra.

3. The wrong coordinate

The point is \((2, 5)\), but the question may want 2, 5, or \(2 + 5\). Underline what is being asked.

4. The wrong angle mode

Desmos can work in radians or degrees. Open the wrench menu and match the setting to the units in the question.

5. The early rounding

Type \(\tfrac13\) as 1/3, not 0.33. Rounded inputs drift further from the answer with every step.

How to practice: use the Desmos testing calculator (choose the College Board SAT version) or the calculator inside the Bluebook practice tests, so you practice on the same calculator you will see on test day. Run each move above until the typing is automatic, so your attention goes to reading the result and checking it against the question.
Your Journey Starts Here

Interested in One-on-One SAT Prep?

Book a free 30-minute consultation to get started. We'll review your student's goals and target score, recommend the right SAT program, and map out the path to a higher score.

Free Consultation 300+ Point SAT* Top 5% of Tutors
★★★★★

“David took the ACT and SAT each only once after his tutoring, and he was accepted to Harvard.”

Katherine K., Salt Lake City Parent

Prefer to talk? Call (801) 508-4080

Book Your Free SAT Consultation

30 Minutes • Phone or Zoom • No Travel Needed

Rated 4.9 · 3,700+ students served

*Our best students have improved 300+ points on the SAT. Most students who complete our programs gain 150 to 300 points. Individual results vary with starting score, effort, and time invested.